The Optimized Flush
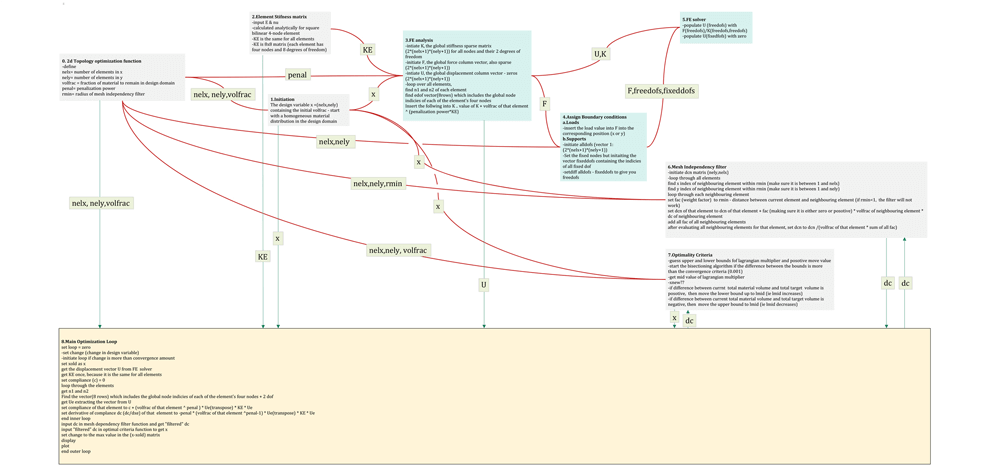
The topology optimization utilized in this exercise was the "A 99 line topology optimization code written in Matlab" by Ole Sigmund (2001). The structure of code was analyzed in order to gain an overall understanding of the method. The code functions were graphically mapped out and the variables exchange among them traced. These functions include: (a) Stiffness matrix assembly which is identical for all elements in the domain (b) Finite element preparation and boundary condition definitions as well as the solver (c) Mesh Independency Filter that is responsible for averaging out densities per element by comparing it to its neighboring elements. This is important as it prevents the emergence of checkerboard solutions and (d) The optimality criteria algorithm which is used here to find the optimum solutions. This is done through guessing the upper and lower bounds of the Lagrangian multiplier and bi-sectioning the domain in half as the iterations proceed.
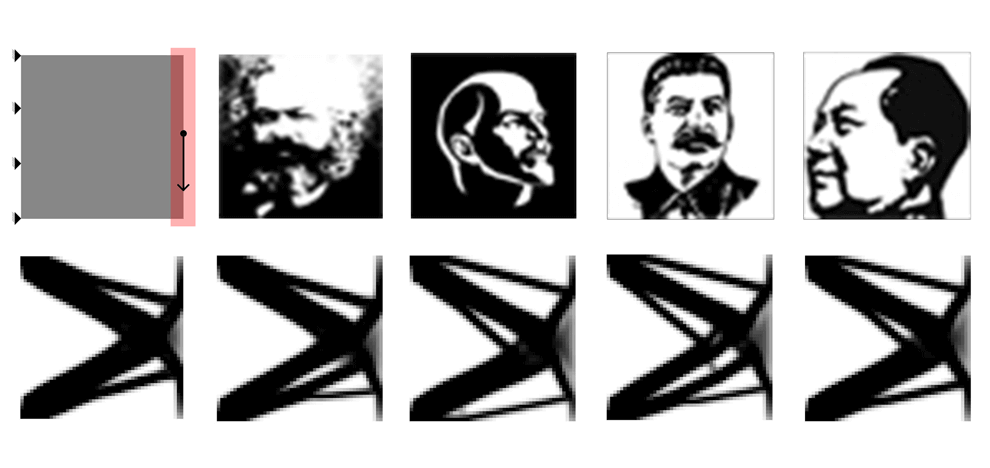
All these functions are then run within the main optimization loop. Before running the optimization iterations, the code assumes a homogeneous material distribution as an initial guess. The material densities matrix “x” is being populated by the volfrac value - that is the volume fraction that the user sets. At 50% volume fraction, %50 of the material domain remains after optimization, and, 50% of the material as assumed to be the very first initial guess of the algorithm. Random bitmaps of varying grayscale values substitute the homogenous initial guess and variations in the output are examined - with all other variables untouched. Sensitivities in the topology optimization code are hence exposed; Local optimums are produced and eventually differences in the output.
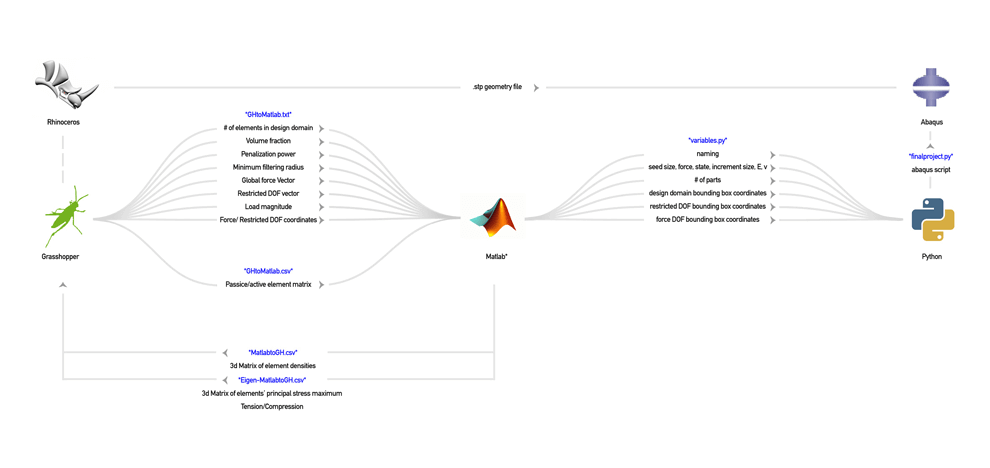
Digital tools developed for this study have been mainly concerned with creating interfaces between domain-segregated platforms that are otherwise not in direct communication. Within the design domain, Rhinoceros and its parametric engine Grasshopper were utilized. Custom components were developed in Grasshopper using C# to perform data exchange and parsing operations. Within the scientific domain, existing Matlab topology optimization routines were utilized. Defining load cases within these routines is a cumbersome process requiring hard coding of each degree of freedom. Hence came the motivation to interface the code with a readily available CAD environment where such variables can be selected and assigned graphically. The user starts in the Grasshopper environment where multiple variables are defined. These include parameters for material structural properties as well as the desired resultant material quantity as a percentage of the entire domain. Users draw any kind of closed BREP, such as a box, to demarcate supported/loaded nodes. Another supplementary selection allows the user to choose the number of degrees; X,Y,Z,XY,XZ,YZ or XYZ. These variables are then passed on to the topology optimization code in Matlab. After the optimization algorithm has converged, results are sent back to grasshopper containing information on the density per element and the number of elements that comprise the "optimum" result. These densities can then be visualized within Rhino.
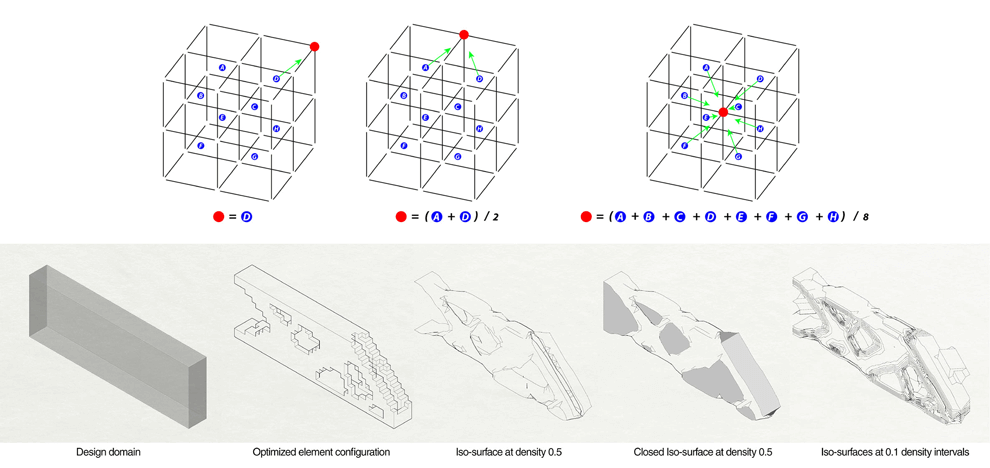
The smoothness of the optimization results is highly dependent on the resolution of the elements comprising it; Squares for 2D problems and cubes for 3D. Even with using high resolutions, the resultant bodies are jagged as they are defined by rectilinear edges. Means of smoothing out these results into meshes were explored. The topology optimization code outputs densities per element and can be simplified as the density of the material at the center of each element. The density values per element is then transfered to the nodes- 8 per element for 3d problems. A code was developed in C# within Grasshopper to preform this task. By looping through the nodes, the code counts how many elements share the same node and sums up the densities of all these elements. A node at the corner of the design domain will only be shared by one element while one in the center will be shared by 8 elements. By dividing the density sum over the number of shared elements, an average density value is obtained at each node. These values, together with their corresponding nodes as points in 3d space, are passed on to the Marching Cubes algorithm developed in 1987 by Lorensen and Cline and is used in reconstructing computer graphics through the interpolation of iso-surfaces between points. The generated iso-surface is hence visualized as an open mesh. The resultant mesh can then be passed on to various fabrication methods.
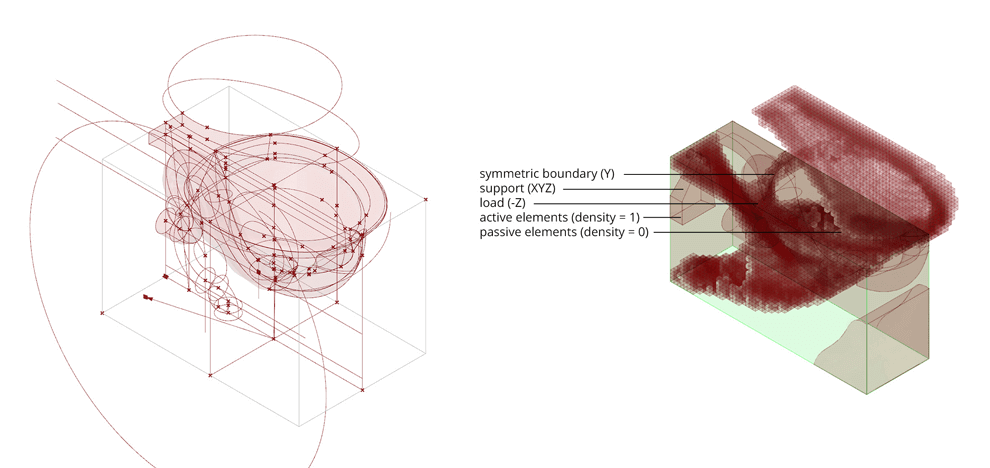
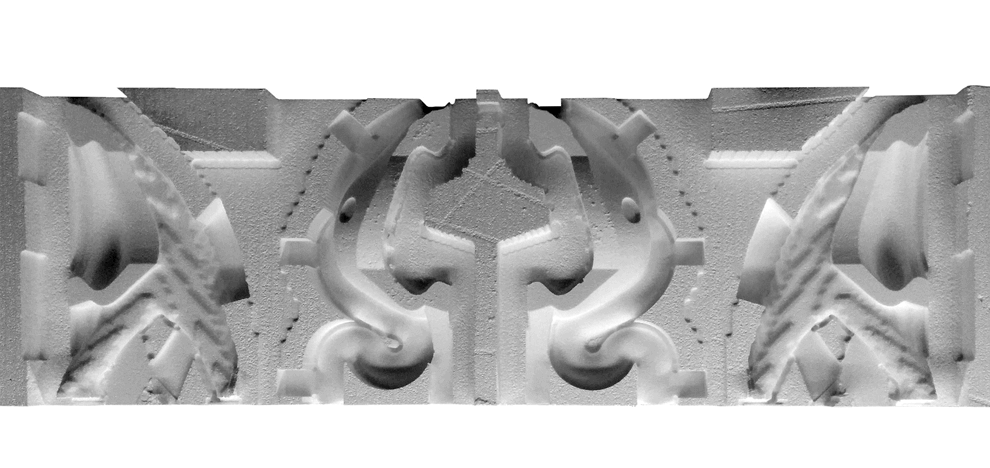
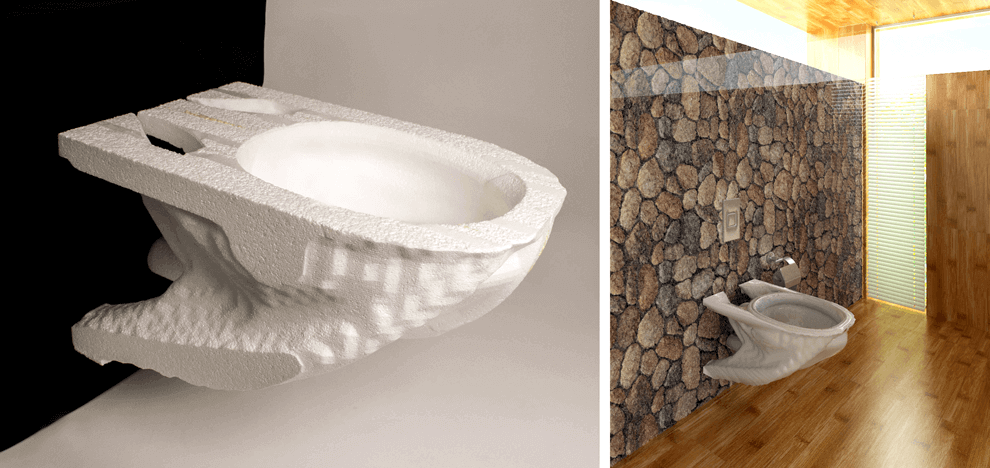
The workflow outlined here has been applied to the design of sanitary ware product as a means of validation and debugging. It also serves as a portal through which topology optimization methods can be explored in the larger industrial design domain. The process starts by parametric geometric definition as well as the definition of the design domain based on ergonomic considerations. Components specific to the functionality of a toilet are modeled including the rim, bowl, inlets, outlets and siphonic jet. The toilet is desgined to be wall-hung and loads are applied at locations where human contact is expected. Elements within these components are then assigned as either passive or active, enabling the transition from pure generic geometry to optimization-specific constituents. As the design domain is symmetrical, it is divided in half with symmetric boundary conditions applied along the slice plane. This reduced the DOFs by half and allowed for faster processing times. Optimized bodies are exported for analysis to Abaqus where real material constrains and loads are applied to validate the results. A ceramic porcelain material is applied to the body and treated as a shell of constant thickness - following a standard used by sanitary ware manufactures. The load created by a reasonably-sized person is applied. The linear mode illustrates the absence of local stress concentrations across the body. Bench marking these results against analysis carried on existing toilets is necessary to confirm improvement in performance. The non-linear results, however, are modeled using a combination of two materials: a material with higher E value as the major structural component and another with a relatively lower E value where human skin comes in contact with the toilet. The main drive behind this distribution is the ergonomic functionality of the toilet. Hence, the nonlinear mode illustrates a structure that buckles under human weight, responds dynamically to the loads applied and reverts back to its original state when loads are removed. In terms of fabrication, elements with a density value of 0.5 or higher have been used to define the optimized body. A 1:1 scale mock-up has been produced from polystyrene foam as a formal representation of such structures. A 3-axis milling router was used to sculpt the structure from 15 cm thick stock. Due to fabrication constraints, the body was divided into four quarters and assembled together. Therefore, the mock-up is able to represent around 90% of the actual optimized geometry. A more appropriate milling technique would be to utilize a 5-axis robotic arm able to reach under-cuts in the geometry and produce a 100% match with the original geometry. Situated at the intersection of science and art, this study explored incorporating Structural Topology Optimization practices into the design field. While such engineering concepts are well integrated within Computer-Aided-Engineering platforms, geometry created in Computer-Aided-Design and Computer-Aided-Manufacturing are often post-rationalized in response to practical considerations. Through bridging computational tools used by different trades, topology optimization routines were integrated in early conceptual design stages. The results were interpreted into tangible objects by exploring relevant fabrication and prototyping techniques. Results were then validated through analysis. The design of sanitary ware was used as a proxy to test the proposed workflow. By linking discipline-based platforms that are otherwise not in direct communication, the designer's intuition is challenged as new formal design languages arise out of pure functional and numerical investigations.
